![Sales Analytics: Complete Guide to Data-Driven Sales [2026]](https://cdn.prod.website-files.com/6262a9705cabe0833039d5c8/68df90717dd425f68d1a05f8_Sales-Analytics.jpg)
In 2024, Gartner found that only 7% of sales organizations achieved forecast accuracy above 90%, while 69% of leaders said forecasting is getting harder (Demand Gen Report ↗). The result? Deals slip, pipelines bloat, and revenue confidence takes a hit.
I’ve been there. You log into your CRM and it’s buzzing with calls, emails, meetings — but not the only question that matters: which actions actually move a deal forward?
That’s the gap sales analytics fills. Done right, it’s not reporting theater. It’s the discipline of stripping out the noise, finding the signal, and turning raw sales data into a competitive edge.
This guide is your practical playbook. We’ll cover:
- What sales analytics really means (and how it differs from reporting)
- The four types of analytics every sales team needs
- The sales metrics that actually matter, from pipeline health to revenue predictability
- How experiments (and coaching) sharpen outreach and win rates
- The best sales analytics tools in 2026
- A roadmap to build your strategy without drowning in bad data
Because the truth is, sales isn’t about logging more activities. It’s about clarity, precision, and leverage. In 2026, analytics is the only way to get there. Forget the old cliché “sales is a numbers game.” The new rule: sales is an analytics game.
👉 Related read: Sales Analytics Tools — a deep dive into platforms that make this guide actionable.
What is Sales Analytics? Definition and core concepts
Most people think sales analytics is just “analyzing data to find trends.” Wrong. Reporting does that.
Sales analytics is the discipline of turning raw activities, pipeline shifts, and customer interactions into insight you can act on. It doesn’t just tell you what happened — it shows you why it happened, and what to do next.
Think of it this way:
- Reporting shows you that 50 demos happened last month
- Analytics tells you which demos converted at the highest rate, why they did, and what to do differently next month
📊 McKinsey research shows that companies using data-driven decision making are 23 times more likely to acquire customers, six times more likely to retain them, and 19 times more likely to be profitable (McKinsey ↗). That’s the power of analytics over gut feel.
Sales Analytics vs. Sales Reporting?
Too many teams confuse analytics with reporting. Here’s a quick table to spot the differences.
In short: reporting monitors; analytics interprets. Reporting tells you the what. Analytics reveals the why and the what next.
👉 Related read: What is conversation Intelligence — how AI-powered call analysis feeds analytics with insights dashboards alone can’t deliver.
The 4 types of Sales Analytics every business needs
Most teams live on the bottom rung of sales analytics. They describe what happened. The best teams climb higher — diagnosing causes, prescribing actions, and ultimately predicting outcomes.
Step 1: Descriptive Analytics — Past Performance
The baseline. It looks at historical sales data — revenue closed, deals won, activities logged. It answers one question: what happened?
💡 Examples: win rates by quarter, seasonal patterns, activity levels by rep..
Step 2: Diagnostic Analytics — Root Causes
The “why.” Win/loss analysis, deal slippage reviews, and spotting correlations between activity type and close rate.
💡 Example: A company discovered rising losses weren’t about product quality but late-stage pricing objections. That insight led to a new enablement program — and higher win rates.
Step 3: Prescriptive Analytics — What to Do Next
Where analytics gets tactical. It moves from insight to recommendation, often powered by AI.
💡 Examples: next-best-action prompts, next outreach approach to test, guided selling playbooks, or A/B test results turned into playbooks.
Step 4: Predictive Analytics — Forecasting the Future
The top rung. Machine learning uses sales pipeline history, activity data, and market signals to forecast outcomes.
AI sales forecasting tools can boost accuracy by 30% while cutting analysis time by 80% (Institute of AI Studies ↗).
💡 Example: A SaaS company used predictive scoring to triage inbound leads. By prioritizing the top 30% most likely to convert, their SDRs doubled pipeline coverage without adding headcount.
Descriptive. Diagnostic. Prescriptive. Predictive. Each step adds value. The question is: where are you today — and how fast can you climb?
👉 Next, let’s talk about the sales metrics that matter most — because analytics without the right KPIs is just noise.
Key sales metrics and sales targets that drive results
Many teams track everything and learn nothing. Elite sales leaders focus on the KPIs that actually move the needle — improving rep performance, keeping the pipeline healthy, and making sales performance reports actionable.
1. North Star Metrics: The Big Picture
Your ultimate guide. ARR, new customers, net new ARR, and total signed revenue show whether you’ll hit goals and sustain long-term growth.
💬 Armand Agha-Musset, Head of Sales for a 15–30 rep team:
The North Star: what’s signed, both clients and revenue. Frequency: every day. My homepage when I open Chrome.
2. Outreach & Activity Metrics: Feeding the Pipeline
These leading indicators reveal pipeline health:
- Outbound activities: calls, emails, LinkedIn touches
- Outreach-to-meeting conversion
- Response rate
- Speed-to-lead
3. Pipeline Health Metrics: Diagnosing Vital Signs
Your pipeline isn’t “fat” — it’s either healthy or sick. These metrics reveal its true state:
- Coverage ratio: pipeline ÷ quota
- Pipeline velocity
- Stage-to-stage conversion
- Abnormal deals: no activity 7+ days, no next step in 14, or cycle > 3 months
💬 As Armand says:
The goal isn’t a fat pipeline. It’s one that’s healthy, active, and moving.
4. Sales Performance Metrics: Measuring the Work
Measure results, not just activity. Focus on:
- Quota attainment
- Win rate %
- Average cycle length
- Productivity per rep
📊 Companies using sales intelligence tools saw a 28% jump in productivity and a 25% lift in revenue within six months. (SuperAGI ↗). Paired with Coaching Software, these insights turn into real, actionable growth.
5. Revenue Metrics: The Economics of Growth
Stop guessing if deals are profitable. Track:
- Number of deals × average deal size × win rate
- MRR/ARR growth
- Expansion vs new ARR
- Lead times
These metrics tell you whether sales are scalable — not just busy.
6. Customer & Expansion Metrics: Value After Win
Revenue isn’t just signed deals — it’s what happens next. Focus on:
- CLV
- NRR
- GRR
- churn
- expansion revenue
📊 McKinsey: companies with strong customer analytics are 1.5 times more likely to grow fast, lifting earnings 15–25% (Psico Smart ↗). Elite teams know retention drives sustainable growth.
7. Forecasting Accuracy and More Accurate Sales Forecasts
Analytics isn’t just about volume — it’s about predictability. Strong forecasting accuracy enables more accurate sales forecasts, sharper sales targets, and confidence for sales leaders.
Bonus: The Winning by Design Bowtie Framework
Winning by Design organizes metrics into three categories, giving teams a clear, visual framework to track performance:
- Volume metrics: number of leads, deals, meetings
- Conversion metrics: rate from input → output (e.g., lead → opportunity)
- Velocity/time metrics: how long it takes for input to become output
Together, these categories give sales leaders a standardized way to measure both acquisition and expansion — the full bowtie journey.
North Star metrics show your destination. Activity and pipeline metrics map the route. Forecasting tells you if you’ll arrive on time. Elite sales teams combine all three — that’s the trifecta of a modern, data-driven sales org.
👉 Next up: moving from metrics to experimentation — using outreach analytics to test, learn, and optimize.
Outreach analytics: test and optimize
Dashboards don’t close deals. Elite sales teams treat analytics as a feedback loop: test, measure, learn, repeat. Outreach is the perfect lab — small improvements compound into big pipeline gains.
A/B Testing Framework
Run weekly experiments on how you engage prospects — subject lines, message tone, timing — and let the data decide..
What to test:
- Subject lines, message length, personalization depth, channel, and send times
How to run it:
- Test one variable at a time
- Minimum 50 contacts per variant for statistical weight
- Track opens, responses, and meetings booked
Decision rules:
- >10% lift adopt
- 0–10% extend
- <0% drop
Example: One SaaS team used personalized subject lines to increase open rates by at least 50%, according to HubSpot research.
Building a Test-and-Learn Culture
Tactical wins are fleeting. Long-term success comes from a culture of experimentation:.
- Use the 70-20-10 rule:
- 70% proven plays
- 20% incremental improvements
- 10% bold experiments
Frame every test as a hypothesis, log results, and scale what works. It’s not about a single subject line — it’s about a system that keeps learning.
💬 Armand: “Experimentation improves what goes into the pipeline. Better inputs mean better outputs — meetings, opportunities, closed deals.”
Outreach analytics ensures your reps aren’t just working harder — they’re working smarter, guided by data.
👉 Next: zoom out from individual reps to platforms — the top sales analytics tools and how to choose the right one.
8 Top sales analytics tools: 2026 comparison
Metrics show what to track. Tools decide whether you’ll get real insight — or just more noise. The right platform doesn’t just pump out reports; it integrates with your workflow, automates insights, and makes analytics usable for the people on the front line.
Most modern sales analytics software acts as a full solution: automating data collection, surfacing insights, and embedding them into daily workflows. Here’s how the 202620 landscape splits:
A - Enterprise Sales Analytics Platforms
Salesforce Analytics

- Strengths: enterprise-grade, Einstein AI, deep CRM integration
- Drawbacks: expensive, admin heavy
- Best for: RevOps-heavy enterprises with IT support
Microsoft Dynamics 365

- Strengths: integration with Office, customer insights, AI forecasting
- Drawbacks: less intuitive UI for non-technical users
- Best for: Microsoft-first organizations with large existing licenses
B - Mid-Market Solutions
HubSpot Sales Hub
- Strengths: intuitive dashboards, predictive lead scoring
- Drawbacks: weaker forecasting than enterprise tools
- Best for: scaling SaaS and B2B teams prioritizing usability
Pipedrive
- Strengths: clean UI, strong pipeline insights, affordable
- Drawbacks: limited predictive and prescriptive analytics
- Best for: SMBs and lean sales teams needing clarity fast
C - Specialized Analytics Tools
Tableau / Power BI (Data Visualization)

- Strengths: rich dashboards, custom visualizations, enterprise-grade BI
- Drawbacks: complex technical setup and maintenance, not sales-native
- Best for: data-mature companies with dedicated analytics teams.
Claap (Conversation Intelligence)
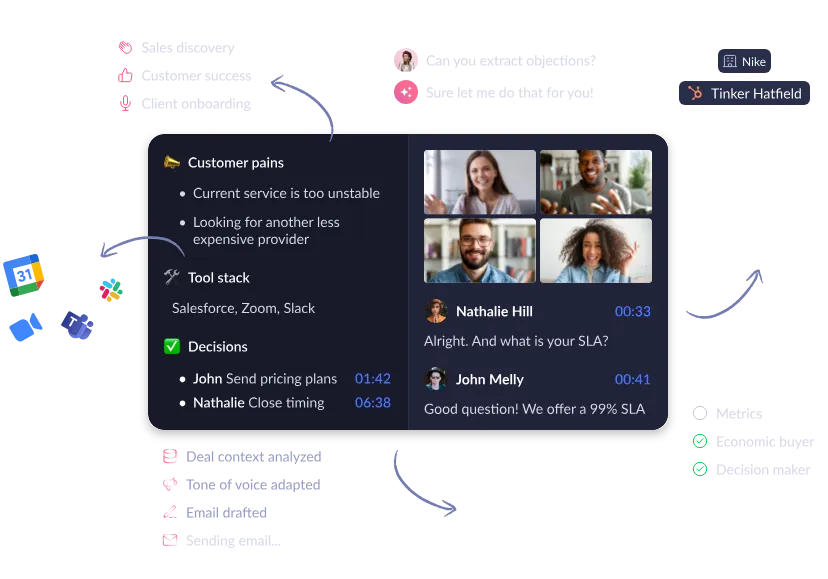
- Strengths: transcribes and analyzes sales calls, surfaces objections, buying signals, and coaching insights
- Drawbacks: not a forecasting tool — but a powerful CRM complement
- Best for: sales teams that want to know why they win (or lose) — and coach reps accordingly (Claap)
Aviso (Forecasting & Predictive Analytics)
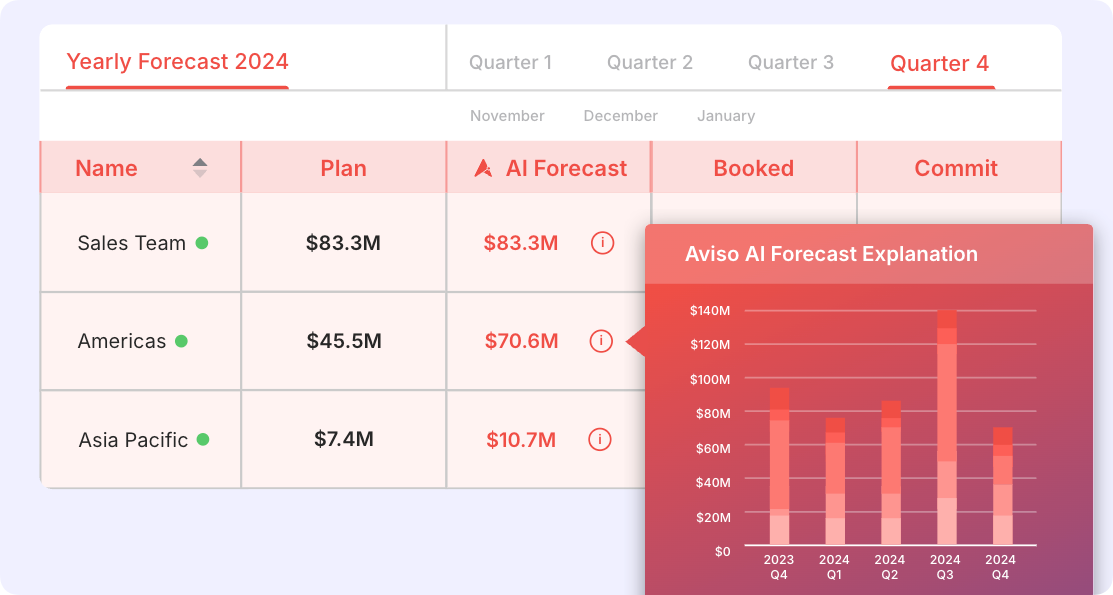
- Strengths: AI-driven forecasting, scenario modeling, risk analysis
- Drawbacks: heavier implementation, enterprise focus
- Best for: orgs where forecast accuracy is mission-critical
There’s no universal “best.” Only the best fit for your maturity and resources:
- Enterprise stack in place? → Salesforce or Dynamics
- Mid-market and scaling? → HubSpot or Pipedrive
- Need deeper insights? → Pair BI with conversation intelligence like Claap
- Struggling with forecasts? → Aviso
And remember: adoption beats features. The tool your reps actually use will outperform the one that looks great in a demo but gathers dust.
👉 Next: the frontier of advanced predictive analytics — where machine learning and AI turn historical data into future advantage.
Advanced techniques for predictive sales analytics
Once you’ve nailed the basics — reporting, diagnostics, pipeline metrics — the next leap is predictive. This is where sales analytics moves from hindsight to foresight. Instead of asking what happened?, you’re asking what happens next? And increasingly, AI has the answers.
Machine Learning in Sales Forecasting
Forecasting used to be gut feel with a spreadsheet buffer. Managers collected rep commits, added a cushion, and hoped for the best. Today, machine learning models weigh thousands of signals — deal stage, activity cadence, buyer persona, historical trends — to predict outcomes far more reliably than human instinct.
Business benefits:
- Eliminates bias in pipeline reviews
- Automates probability scoring per opportunity
- Flags slipping deals well before quarter-end
By 2026, Gartner predicts B2B sales teams using generative AI will cut prospecting and meeting prep time by more the 50% (Microsoft ↗), freeing reps to spend more time in front of customers. Forecasting accuracy will only sharpen as models train on richer datasets.
For sales leaders, tracking Market Trends ensures predictive models aren’t just historical, but reflect shifting buyer behaviors and external context.
AI-Powered Lead Scoring
Not all leads are created equal. Traditional scoring assigns points for firmographics or website visits. AI takes it further — layering in engagement signals, conversation data, and historical close rates.
Business benefits:
- Ensures reps focus on the 20% of leads most likely to close
- Surfaces hidden drivers (e.g., deals including CFO close 30% faster)
- Continuously learns and adapts as win/loss data accumulates
For SDR managers, this means time isn’t wasted chasing “busy leads” that never convert. The highest-probability accounts get prioritized, boosting pipeline efficiency without extra headcount.
Customer Churn Prediction
Case studies show SaaS providers cutting churn by double digits within six months, simply by flagging reduced usage and re-engaging accounts before renewal.
Predictive analytics doesn’t replace sales judgment. It augments it. Managers still coach. Reps still build relationships. But now they’re guided by probabilities, not guesswork.
👉 Next: let’s bring it all together into a step-by-step strategy for implementing sales analytics — from planning to adoption.
How to build your sales analytics strategy
Analytics isn’t a switch you flip. It’s a discipline — one that requires clarity, alignment, and adoption. Here’s a four-phase roadmap you can actually follow.
Phase 1: Foundation and Planning
Every analytics journey starts with one question: what problem are we trying to solve?
- Define objectives
- Align stakeholders
- Set success metrics upfront
Phase 2: Data Plumbing
Your analytics are only as good as your data foundation.
- Map systems
- Fill gaps
- Build a single source of truth
Phase 3: Adoption
Even the smartest dashboards are useless if nobody uses them. Adoption requires change management.
- Roll out dashboards gradually
- Coach with data, not anecdotes
- If reps feel the lift, adoption follows naturally
Phase 4: Scale
Once the basics are embedded, expand.
- Layer in predictive features
- Refine KPIs
- Scale analytics org-wide
Data quality and integration challenges
Here’s the hard truth: most analytics projects fail not because of bad software, but because of bad data. Garbage in, garbage out.
Common Pitfalls
- CRM not syncing with marketing automation
- Manual rep data entry
- Delays in finance or billing updates
Fixes that Work
- Use middleware or ETL tools to connect systems
- Automate data capture wherever possible
- Standardize fields across platforms (no more “Prospect / Lead / Opportunity” all meaning the same thing)
📊 Poor data isn’t just inconvenient — Gartner estimates it costs the average enterprise $12.9–$15M annually (First Eigen ↗).
Ensuring Data Quality and Accuracy
- Assign ownership (Ops should own hygiene, not reps)
- Enforce validation rules (dropdowns, mandatory fields)
- Run monthly audits and spot checks
📊 Research shows data teams spend 50% of their time fixing bad data, and 40% of customers say inconsistent formats affect matching accuracy (DataLere ↗).
Data is the foundation of analytics. Get it wrong, and every insight is shaky. Get it right, and the same systems become a competitive advantage.
We’ve now covered the full journey: what sales analytics is, the types to master, the metrics that matter, the tools to enable them, and the strategy to make it stick. Now it’s time to put analytics to work.
FAQs on Sales Analytics
1. How does sales analytics differ from CRM reporting?
CRM reporting shows activity — calls made, deals created, revenue booked. Sales analytics goes further by uncovering patterns, diagnosing why results happen, and predicting what will happen next.
2. What’s the difference between sales analytics and sales intelligence?
Sales analytics interprets internal sales data to drive insights and decisions, while sales intelligence enriches that data with external signals like buyer intent, firmographics, or market trends. The two complement each other — intelligence feeds analytics.
3. How do you implement sales analytics in a small business?
Start with the basics inside your CRM: track a handful of core metrics such as ARR, win rates, and pipeline coverage. Once you’ve built consistent reporting, add lightweight analytics tools that integrate easily, and scale complexity only as your team grows.
4. How does AI improve sales analytics?
AI enhances analytics by automating data processing, identifying patterns in massive datasets, and generating predictive insights such as lead scores, churn risks, or forecast probabilities that humans alone would miss.
5. What integrations are needed for effective sales analytics?
At minimum, you need your CRM, marketing automation, customer success platform, and billing system connected so data flows smoothly across the entire customer journey and creates a single source of truth.
6. How do you measure the ROI of sales analytics tools?
ROI comes from improvements in forecast accuracy, sales productivity, and revenue outcomes. Track efficiency and revenue gains, and weigh them against tool costs and implementation effort.
7. What compliance issues should I consider with sales analytics?
Sales analytics involves handling sensitive customer data, so compliance with regulations like GDPR and CCPA is essential. Choose vendors with clear data governance, encryption, and audit processes, and align analytics practices with your legal and security teams.
8. How often should sales analytics reports be reviewed?
Daily for North Star metrics like revenue and pipeline creation, weekly for activity and pipeline health, monthly for lost deal and objection analysis, and quarterly for forecast accuracy — with real-time dashboards always available to managers.
9. What’s the difference between predictive and prescriptive sales analytics?
Predictive analytics forecasts outcomes such as win probability or expected churn, while prescriptive analytics recommends the actions to take next — for example, predictive flags a deal at risk, and prescriptive suggests pulling the CFO into the next meeting.
FAQ


![13 Key SaaS Sales Metrics with Examples [2026]](https://cdn.prod.website-files.com/6262a9705cabe0833039d5c8/69f2196ff5c3175e25c258d7_Visual%20(3).png)
.png)
.png)
