55% of first-time CRM users started with spreadsheets.
And I get why. Spreadsheets make you really understand your pipeline before you automate it. You see every stage, every leak, every missed follow-up.
The most efficient teams I’ve worked with began exactly this way. Rally UXR, for example, audited all their closed-won and closed-lost data in one simple sheet. And used it to clarify their ICP, refine their sales motion, and plan their first revenue hire.
But growth eventually outruns the spreadsheet.
You generate more leads than a sheet can handle. Your team grows, versions multiply, and suddenly follow-ups slip, forecasts drift, and nobody agrees on the truth anymore.
Spreadsheets are a great way to start, but they’re a tough way to scale.
This guide gives you 5+ expert-built sales tracking templates you can use today - and the strategic path beyond them: when they work, when they break, and how to evolve from manual tracking to a scalable, insight-driven sales system.
Let’s dive in!
5+ Best Free Sales Tracking Spreadsheet Templates (Google Sheet + Excel)
I’ve tested dozens of sales trackers over the years. These are the templates I recommend most often to reps, managers, and early-stage teams. Each one solves a specific job and removes the guesswork from setting up (or fixing) your pipeline.
Template 1: Daily sales tracker (best for activity monitoring)
When you need consistency, a daily tracker does the job. It gives you a simple log you update once a day, whether you’re hitting activity targets, moving deals forward, or losing momentum mid-week.
- What’s inside:
- Auto-populated daily rows + running MTD (month-to-date) totals
- Activity metrics (calls, emails, meetings, proposals)
- A streak tracker showing consecutive goal-hit days
- Conditional formatting to signal “on track” vs “off track”
- Ideal for:
- Individual reps, inside sales reps, commission-heavy roles
- Fast sales cycles (1-14 days)
- Anyone who needs visibility on habits, not just outcomes
- Small teams (1-10 reps)
- What it solves immediately:
- Daily accountability
- Momentum tracking
- Clearer productivity patterns
It brings instant value through: daily accountability, momentum tracking and a clear view of your productivity patterns
👉 Download it here
Template 2: Monthly sales tracker (best for quota tracking)
Monthly quotas require a wider lens. This template gives you visibility into quota attainments, trend lines, and month-over-month performance, without having to build dashboards from scratch.
- What’s inside:
- Monthly summaries (revenue, deals, average deal size, win rate)
- Quota tracking with variance + achievement %
- MoM and YoY comparisons
- Quarterly roll ups and trend charts
- Clear YTD indicators (ahead / on track / behind)
- Best for:
- Quota-carrying reps
- Managers reviewing performance quarterly
- Recurring revenue or renewal motions
- Teams of 1–20 reps
- What it improves:
- Quota attainment clarity
- Trend visibility
- YoY/quarterly planning
- Cleaner conversations with leadership
👉 Download it here
Template 3: Team pipeline manager (best for small teams)
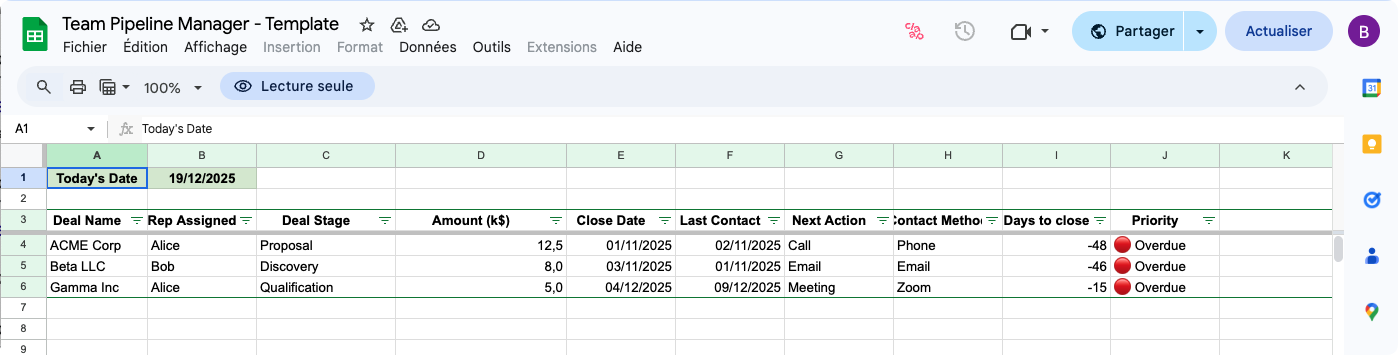
This spreadsheet fills that gap by adding structure, team visibility, and priority management without heavy setup.
1. What’s inside:
- Smart color-coding using TODAY() (red = overdue, orange = today, yellow = this week)
- Rep assignment dropdowns + rep-specific filtered views
- A simple dashboard by rep and stage
- Activity tracking (last contact, next step, contact method)
- Optional team metrics: win rate, average deal size, sales cycle length
2. Ideal for:
- Small business sales teams
- Inside sales groups
- SDR/BDR teams (2–10 reps)
3. Perfect use cases:
- Daily stand ups
- Weekly pipeline reviews
- Preventing silent deal leaks
- Coordinating team priorities
4. What it delivers:
- Team accountability
- Visibility on urgent deals
- Manager-friendly dashboards
- A lightweight, shared system
👉 Download it here
Template 4: Forecasting Pro Template (best for financial planning)
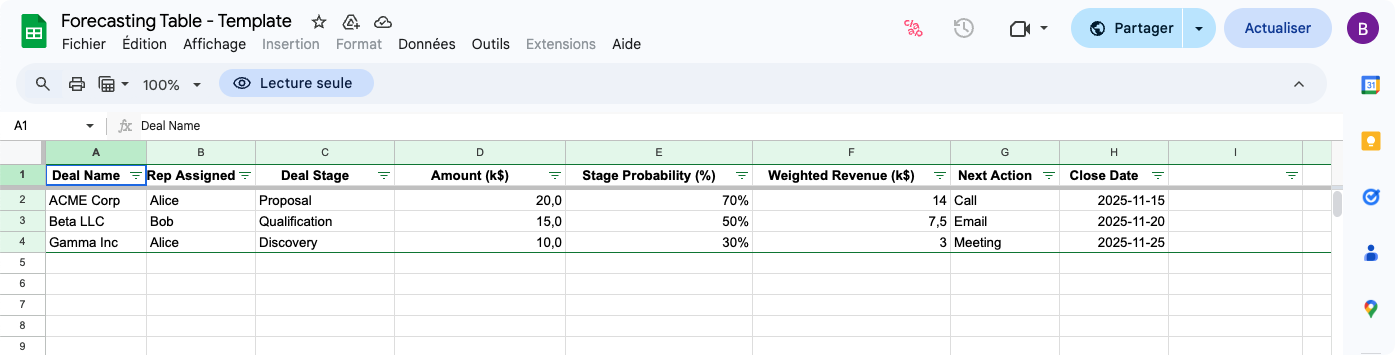
Forecasting sits between sales and finance. This template gives you a structured, probability-weighted forecast without needing a CRM plugin or BI tool.
- What’s inside:
- Weighted forecast engine with stage-based probabilities (10-90%)
- Quarterly planning tabs (Q1-Q4) + rollup dashboard
- Multi-scenario views (best / likely / worst case)
- Pipeline coverage formulas based on historical win rates
- Export-ready report formats for investors or leadership
- Perfect for:
- Sales managers
- Revenue operations
- VP Sales
- Founders creating board updates
- What it unlocks:
- Accurate projections
- Proactive pipeline gap detection
- Stronger budget conversations
- Board-ready and/or investor-ready reporting
👉 Download it here
Template 5: Complete sales system (best for growing teams)
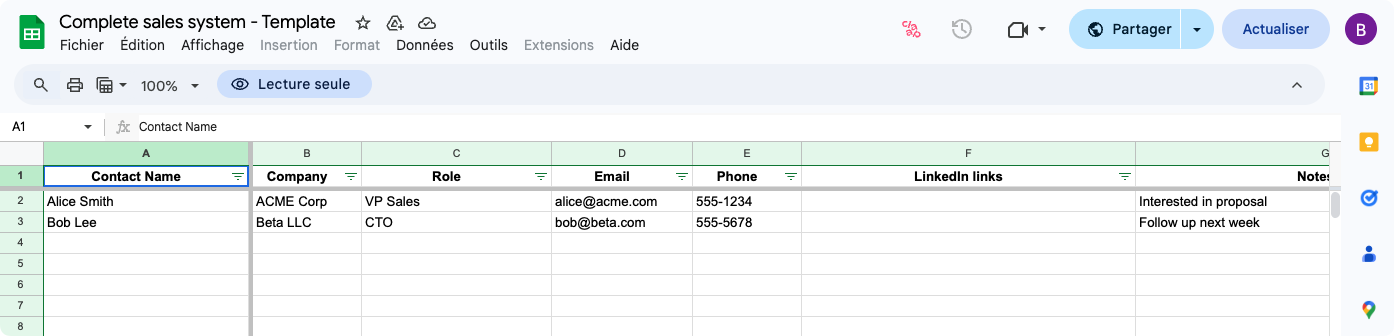
At some point, you need more than a tracker. You need something that starts to behave like a CRM without forcing the full migration yet.
This template is the closest you can get to that middle ground.
- What’s inside:
- Multi-tab system (Contacts, Companies, Opportunities, Activities, Dashboard)
- Relational structure using VLOOKUP to connect objects
- Complete contact database (handles multi-stakeholder deals)
- Detailed activity logs (type, outcome, next step)
- Standardized dropdowns for clean, consistent data
- Who it’s best for:
- B2B teams, companies
- 3-12 month sales cycles
- deals with multiple decision-makers
- teams preparing for a proper CRM implementation
- 10-25 reps (or smaller teams with complex deals)
- What it delivers:
- CRM-level organization
- Clean and reliable activity history
- Strong data hygiene
- Easy migration later (HubSpot, Salesforce, Pipedrive, etc.)
👉 Download it here
How to set up your sales tracking spreadsheet in 5 steps
A sales tracker only works if its structure is solid. Most problems I see in spreadsheets come from:
- Unclear stages: reps can’t tell where deals stand, so forecasting becomes guesswork
- Too many unnecessary fields: clutter slows updates and kills adoption
- No visual system to prioritize deals: teams lose track of what needs attention today
- No process discipline behind the sheet: without routine updates, even the best tracker becomes useless.
Here’s the exact setup I recommend when teams build or customize their sales tracking sheet, step by step.
Step 1: Define your sales process and stages
Your spreadsheet is only as good as the process it represents. Before adding a single column, map the journey a deal takes from first touch to closed-won or closed-lost.
I usually keep it to 4-7 stages. Enough to capture reality, not enough to introduce noise.
A clean set might include the same mental model of how a deal should progress:
Lead → Qualified → Proposal → Negotiation → Closed Won/Lost.
Why it matters?
Everyone on the team should know exactly what moves a deal from one stage to the next. That discipline makes reports meaningful and forecasts trustworthy.
As Jim Keenan puts it:
“Forecasting starts and ends with CRM hygiene and clear, consistent qualification criteria.”
Step 2: Choose the right template for your needs
Choose the simplest possible template that fits your motion. Teams slow themselves down by choosing something more complex than they actually need.
Here’s the quick decision framework I use:
- Daily activity focus: Go with the Daily Sales Tracker (it reinforces habits and keeps cycles tight)
- Monthly quota tracking: Use the Monthly Sales Tracker for trends, quota attainment, and planning.
- Small teams (2-10 reps): The Team Pipeline Manager gives you color-coded priorities and shared visibility.
- Forecasting-heavy roles: The Forecasting Pro Template helps you communicate clear numbers to leadership or investors.
- B2B complexity or growth: The Complete Sales System acts as a CRM-lite until your team is ready for the real thing.
Step 3: Set up essential columns and data fields
A spreadsheet becomes unusable the moment it tries to mimic a full CRM. The moment it feels heavy, reps stop updating it and your pipeline loses all credibility.
Keep it lean, consistent, and decision-focused. Add fields only when they unlock better decisions
At minimum, include:
- Contact name
- Company
- Deal value
- Stage
- Assigned rep
- Next action & next action date
Then add context fields that help with prioritization:
- Lead source
- Last contact date
- Contact method
- Notes
Once the structure is clear, add formulas:
- Weighted forecast: so leadership always sees the real number.
- Win rate: nothing tells the truth about your funnel faster than this metric.
- Pipeline totals: you need instant visibility on whether you’re actually covered for the quarter.
- Activity counts: track the inputs that drive outcomes.
Make the sheet do the math, not your reps.
Step 4: Implement color-coding and conditional formatting
This is where the spreadsheet becomes usable at a glance. Reps know exactly what needs attention without digging through the entire file.
Color-coding removes the need to inspect every row, especially during busy weeks.
A simple system works best:
- Red: overdue
- Orange: due today
- Yellow: due this week
- Green: on track
- Grey: future dates
Then add status formatting:
- Green for deals that moved forward
- Yellow for stalled opportunities
- Red for at-risk deals
Google Sheets and Excel both support conditional formatting based on dates, text, and custom formulas. Once set up, it builds a visual priority engine that reps can act on instantly.
Step 5: Add automation and notifications
Automation is how you keep the system alive without constant supervision.
The essentials:
- Automatic calculations for total pipeline, win rates, and average deal size
- Dashboards that update whenever data changes
- Weekly digests showing overdue activities or stalled deals
- Automated email reminders for overdue tasks (via Google Sheets add-ons)
These micro-automations save hours of admin and ensure the file remains a single source of truth as the pipeline grows.
Setting up a sales tracking spreadsheet is simple. Maintaining one requires consistency and process discipline.
Essential metrics to track in your sales spreadsheet
A spreadsheet is only useful if it helps you make faster decisions.
The teams who get real value from spreadsheets track a focused set of sales metrics that highlight where deals stall, where reps get blocked, and where revenue is won or lost.
Here are the core metrics I recommend tracking from day one:
- Pipeline metrics show the health of your funnel (it tells you if you’re set up to hit the quarter or already behind)
- Track: total pipeline value, weighted forecast, deal count by stage, and average deal size
If these numbers are off, everything downstream is unreliable.
- Activity metrics reveal whether deals move because reps engage consistently. It is the input that drives every outcome in your pipeline.
- Track: calls, emails, meetings, and follow-up completion.
These show if reps are actually putting deals in motion.
- Performance metrics show conversion efficiency. This is where you see if your process works or if it’s leaking revenue.
- Track: win rate, stage-to-stage conversion, sales cycle length, and quota attainment).
Your sheet should surface issues long before the quarter ends.
- Velocity metrics expose revenue leaks by showing how fast deals move through each stage.
- Track: time in stage, forward vs. backward movement, and closing speed trends.
Slow velocity is the silent killer in most funnels.
Brent Holloway emphasizes analyzing closed-won and closed-lost data by company size, tech stack, and customer segment to surface the highest-efficiency opportunities. His approach helped teams pinpoint the top 10-15% of accounts driving the most predictable revenue lift.
Best practices for maintaining your sales tracking spreadsheet
A spreadsheet only works if it’s always current. The moment it falls out of date, it’s only fiction.
The teams that keep clean data follow a simple rhythm (consistency beats complexity every time):
- update daily: a 30-second habit keeps your pipeline accurate and prevents surprise gaps
- review weekly: this is where you realign priorities and kill stalled deals before they rot
- optimize quarterly: tighten stages, clean fields, and remove noise so the system scales with you
The daily rule is easy:
- Spend 30 seconds updating your pipeline, just like Marcus Chan’s top-performing teams. He used this workflow to help a B2B SaaS team recover from 20-50% quota misses over three straight years, improving visibility and restoring pipeline discipline across 25-250 AEs. Check out our article on sales efficiency here.
- Keep strict hygiene: clear qualification criteria, consistent naming, and regular cleanup of dead deals.
- Make the sheet a single source of truth with defined owners and set update times.
As Jim Keenan reminds us, nothing kills a forecast faster than
“hundreds of opportunities that aren’t real.”
When to transition from spreadsheets to CRM
Spreadsheets work - until they don’t.
You’ll feel the breaking point when:
- you exceed ~100 active leads
- more than 5 people update the same file
- version control and visibility become chaotic
- follow-ups slip because the system relies on memory
- you need integrations, automation, or mobile access
The real cost is opportunity loss: when manual updates take longer than selling.
As Close CRM puts it, spreadsheets “hit the fan” past a certain scale. Sticking to them slows teams more than it helps.
And that’s exactly where Claap steps in. Instead of juggling notes, calls, and scattered updates across Excel sheets or your CRM, it captures your sales conversations, takes notes for you, turns them into structured summaries then syncs the important details automatically to any tool: CRM, Excel, Notion, Slack, and more. You stay focused on selling; everything else is handled for you.
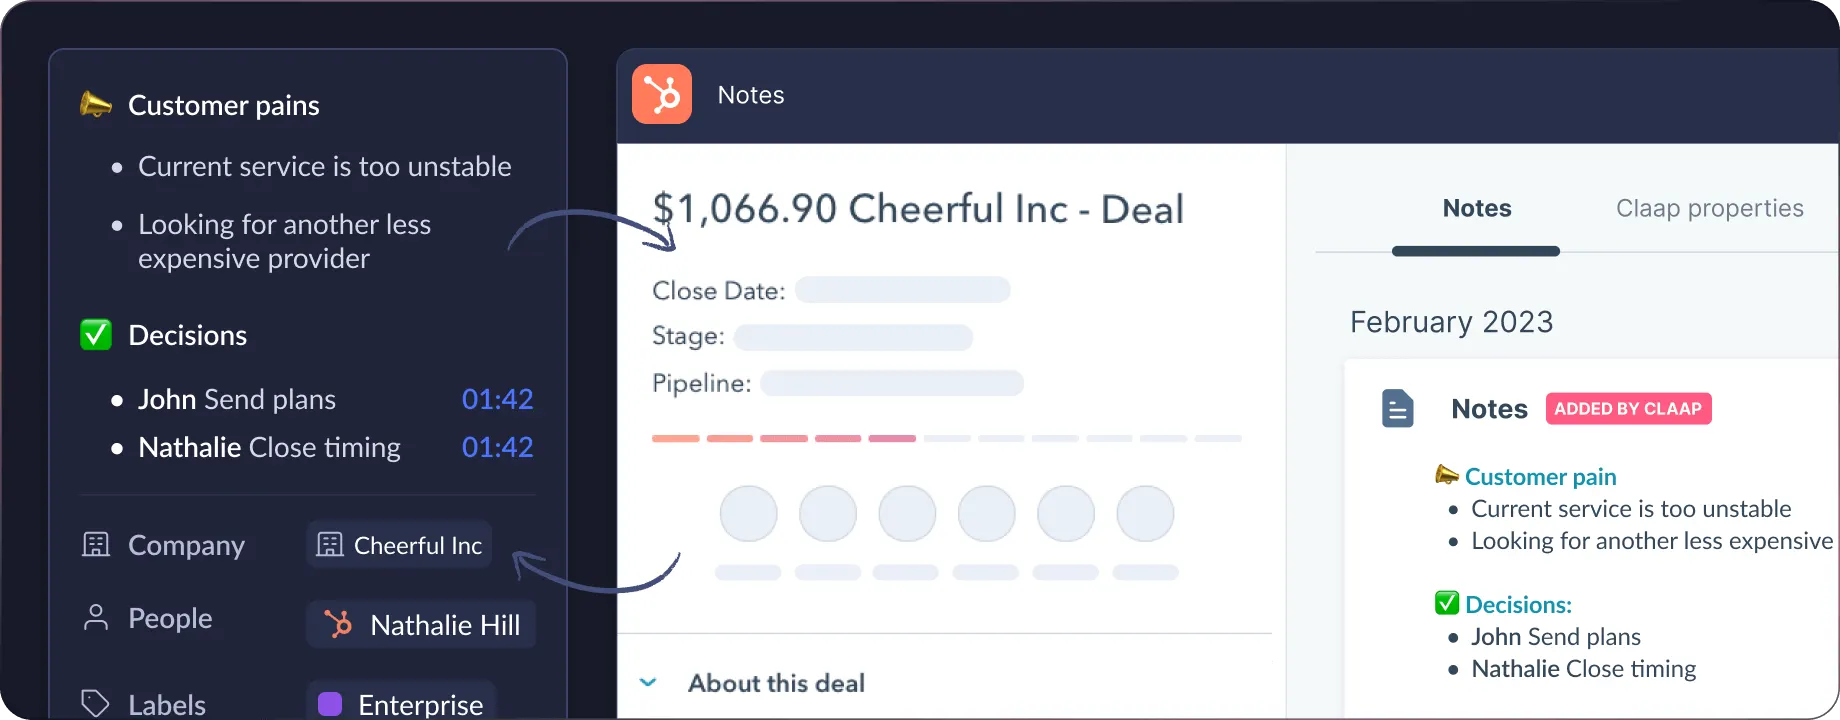
👉 Book a demo with Claap to explore more.
Common spreadsheet limitations and workarounds
Most spreadsheet issues come from scale. Here’s how to extend their lifespan:
1. Collaboration breaks quickly → use Google Sheets
Real-time edits, permissions, and version history avoid chaos.
2. Data accuracy drops → rely on structure
Use dropdowns, validation rules, and scheduled data hygiene.
3. Manual work becomes overwhelming → automate
Use formulas, templates, add-ons for reminders or alerts.
4. CRM migration becomes painful → prepare early
Keep consistent naming, simple fields, and clean categories. Future-you will thank you.
FAQ
Can I automate my sales tracking spreadsheet?
Yes. You can automate reminders, calculations, dashboards, and even email notifications using built-in formulas, add-ons, and connected tools. Most teams automate forecasts, follow-ups, and activity rollups.
How do I share a sales tracking spreadsheet with my team?
Use Google Sheets for real-time collaboration. Set permissions, lock formulas, and rely on version history to protect data. For larger teams, create naming conventions and clear update rules to avoid duplicates and maintain a single source of truth.
What’s the difference between Excel and Google Sheets for sales tracking?
Google Sheets is better for collaboration; Excel is better for advanced modeling. Sheets is ideal when multiple people update the same pipeline, while Excel shines for heavy calculations, forecasting, and offline work. Many teams use both.
What formulas are essential for sales tracking spreadsheets?
Start with SUMIF, COUNTIF, AVERAGE, IF statements, and weighted forecast formulas. They cover most pipeline, win rate, and performance needs. Advanced setups use XLOOKUP or VLOOKUP to link contacts, accounts, and opportunities across tabs.
How do I create a sales tracking spreadsheet from scratch?
Begin with a simple table: company, contact, deal value, stage, next action, owner. Add formulas, dropdowns, validation, and color-coding only after the structure works. For CRM-style organization, add separate Contacts, Companies, and Activities tabs.
How often should I update my sales tracking spreadsheet?
Daily. A quick 30-second update per rep keeps the pipeline accurate and prevents surprises. Weekly reviews help realign priorities, and this routine is the key to long-term data hygiene.
When should I stop using spreadsheets and get a CRM?
Once you exceed ~50 leads, have more than 2–3 users, or need automation beyond manual tracking. If you require email logging, workflows, mobile access, or detailed activity history, a CRM will save time and prevent lost deals.


![13 Key SaaS Sales Metrics with Examples [2026]](https://cdn.prod.website-files.com/6262a9705cabe0833039d5c8/69f2196ff5c3175e25c258d7_Visual%20(3).png)
.png)
.png)
