In H1 2025, 76% of B2B sellers missed quota (Ebsta & Pavilion, 2025 GTM Benchmarks). Dashboards multiplied; wins didn’t. The paradox? Teams track dozens of sales metrics—but act on a handful.
Sales metrics are the key performance indicators sales leaders use to judge overall sales performance across the entire sales process.
This guide focuses on the 12 sales KPIs that actually drive revenue in 2026, directly tied to your sales process.
- Daily: activity metrics you can coach right away
- Weekly: performance metrics that improve efficiency
- Monthly/Quarterly: strategic metrics that fuel growth
Forget vanity dashboards. We’ll zero in on the metrics that help sales managers coach faster and sales teams win more.
First up: a quick-reference table for your next pipeline review.
What are the 12 essential sales metrics?
This quick-reference table gives you the formulas, benchmarks, and review cadence for the KPIs that actually move revenue. Use it as a checklist in your next pipeline review.*Note: Benchmarks vary by sales model, deal size, and go-to-market strategy.
| Metric | Tier | Formula / Definition | Benchmark / Target | Review | Why it matters |
|---|---|---|---|---|---|
| Qualified Sales Conversations | Activity | # of meaningful sales dialogues per period (prospect fits ICP + shows intent) | SDR: 15–20 daily | AE: 8–12 daily (varies by ACV/segment) | Daily | Directly predicts pipeline creation |
| Lead Response Time (Inbound) | Activity | Minutes from inbound lead creation → first contact | Target: <1h | Best-in-class: <5 min | Continuous | 35–50% of deals go to first responder; conversion 8–21× higher under 5 min |
| Pipeline Additions | Activity | New qualified opportunities created weekly | Pipeline ≥ 3–5× weekly quota | Weekly | Leading indicator of revenue 30–90 days out |
| Outreach → Meeting Rate | Activity | (Meetings booked ÷ total outreach) × 100 | 2–3% (cold) | 15–20% (warm) | Weekly | Tests list quality & messaging effectiveness |
| Meeting → Opportunity Conversion | Activity | (Qualified opps ÷ total meetings) × 100 | 25–40% (varies by market/ICP) | Weekly | Reveals discovery quality & qualification rigor |
| Sales Velocity | Performance | (Opportunities × Deal size × Win rate) ÷ Cycle length | Track +10% QoQ improvement | Monthly | Shows how fast revenue flows through the pipeline |
| Win Rate | Performance | (Closed-won ÷ total opportunities) × 100 | 2025 reality: ~19% | Target: 20–30% | Best-in-class: 30%+ | Weekly | Small improvements yield outsized revenue impact |
| Average Deal Size | Performance | Total revenue ÷ # of deals | Target: +20% YoY (adjust per segment) | Monthly | Multiplies revenue; flags upsell/discounting issues |
| Sales Cycle Length | Performance | Days from first touch → closed-won | SMB: <30 days | Mid-market: 30–90 days | Enterprise: 90–180 days | Monthly | Shorter cycles = faster growth & better forecasting |
| Customer Acquisition Cost (CAC) | Strategic | (Sales + Marketing costs) ÷ new customers | Target: <⅓ of ACV | Quarterly | Core profitability guardrail |
| CLV:CAC Ratio | Strategic | Customer Lifetime Value ÷ CAC | 3:1 minimum | 4:1 optimal | Quarterly | Ultimate health check; <3:1 = unsustainable growth |
| Pipeline Coverage | Strategic | Total pipeline value ÷ quota | 3× minimum | 4–5× if win rate low | Weekly | Confidence indicator; <3× almost always signals a miss |
Framework: 3 Tiers That Keep Teams Sane
- Tier 1 (base): 5 Activity metrics — daily coaching and list/message tests.
- Tier 2 (middle): 4 Performance metrics — weekly efficiency tune-ups.
- Tier 3 (peak): 3 Strategic metrics — monthly or quarterly planning and board-level discussions.
No more dashboard theater: each tier has clear ownership and time-boxed reviews, all pointed at sales velocity—the outcome that truly matters.
💡Alternative framing: cross-check with Winning by Design’s Bowtie model: Volume (inputs), Conversion (effectiveness), Time (speed).
Tier 1: The 5 Activity Metrics (daily coaching levers)
Daily inputs that fuel tomorrow’s pipeline. These are the signals you can coach before lunch—ignore them and you’ll be coaching excuses instead of outcomes.
1) Qualified conversations
Most teams obsess over calls made or emails sent. That’s the wrong scoreboard. Activity volume doesn’t matter if it doesn’t spark real conversations.
What actually moves the needle is qualified sales conversations — dialogues where the prospect fits your ICP (Ideal Customer Profile) and shows genuine intent.
Benchmarks:
- SDRs: 15–20 per day
- AEs: 8–12 per day (varies by ACV and segment)
Anything less, and your pipeline won’t cover quota. Anything more, and you’re trading quality for volume.
👉 Why it matters: This is the leading indicator of pipeline creation. Miss this, and 30–60 days later you’ll miss your number.
💡Tips: The key is measurement. Don’t rely on reps to self-report “meaningful conversations” — automate it. Tools like Claap’s Conversation Intelligence can tag discovery calls, flag objections, and score conversation quality automatically. That way, managers coach from real call highlights instead of chasing CRM Notes or spreadsheets.
2) Lead response time (inbound)
Speed-to-lead still wins. Reps who wait hours to follow up on inbound leads lose deals before they even start.
Benchmarks:
- <1 hour = competitive
- <5 minutes = best-in-class (8–21× higher conversion rates in Oldroyd’s lead response study, first responder wins ~50% of deals)
Review cadence: Continuous — track it in real time.
👉 Why it matters: Inbound leads are intent-rich. Respond fast and you win. Respond slow and you’re invisible.
💡Tips: The fix isn’t heroic effort; it’s systems. Route leads instantly, set a <1h SLA, and use Slack alerts to shrink the response gap. Think of it as your team’s reflex.
3) Pipeline additions (new opps)
Every week, ask: Are we feeding the pipeline? If not, no amount of closing magic will save you 60 days later.
Benchmark: Pipeline should grow by 3–5× quota each week (coverage math: win rate × deal size × cycle length).
👉 Why it matters: A consistent stream of new opportunities is the oxygen of revenue. Starve the pipeline, and growth stalls.
4) Activity→Meeting Conversion Rate
More dials ≠ more meetings. The real signal is the conversion from outreach touches to booked meetings.
Benchmarks:
- Cold outreach: 2–3%
- Warm outreach: 15–20%
👉 Why it matters: Slippage here usually means bad lists or weak messaging—not lazy reps. Coach the first three touches; if they don’t land, no cadence wizardry will.
💡Tips. Sales call analysis softwares can help: pull clips from successful prospecting calls and use them to fine-tune sequences or train reps.
5) Meeting→Opportunity Conversion Rate
Not every meeting deserves to become an opportunity—and that’s healthy.
Benchmark: 25–40% of meetings should convert to qualified opportunities.
👉 Why it matters: Too high, and you’re rubber-stamping every conversation. Too low, and discovery is weak. This is where qualification frameworks (MEDDIC, BANT, SPICED) prove their worth.
Tier 2: The 4 Performance Metrics (weekly efficiency checks)
These KPIs show if your activity is actually turning into revenue. They’re the weekly gut-check on efficiency: are we working smart, or just working?
6) Sales Velocity (the compound metric)
If you could only track one KPI, track sales velocity.
Formula: (Opportunities × Deal size × Win rate) ÷ Sales cycle length
Benchmark: Aim for +10% improvement QoQ.
👉 Why it matters: It’s the closest thing to “how fast money moves through your pipeline.” Improve any lever by 10%, and velocity compounds.
7) Win rate
Benchmark: Average B2B win rate fell to ~19% in 2025. A practical target is 20–30%, while best-in-class teams push 30%+.
👉 Why it matters: Even small improvements here unlock outsized revenue. When win rate dips, don’t blame reps first. Check ICP fit, qualification rigor, and whether real “loss reasons” are logged.
8) Average deal size
This is sales’ version of compound interest. Even small lifts dramatically change revenue outcomes.
Benchmark: Target +20% YoY, adjusted by segment.
👉 Why it matters: Watch for discounting and expansion signals. A disciplined pricing strategy and smart upsell motion protect margin and accelerate growth.
9) Sales cycle length
Long cycles kill momentum and forecasting accuracy.
Benchmarks:
- SMB: <30 days
- Mid-market: 30–90 days
- Enterprise: 90–180 days
👉 Why it matters: A long cycle usually signals process friction: missing next steps, approvals, or bottlenecks in security reviews.
💡Tips. Sales performance metrics are the weekly gut-check: are we efficient, or are we wasting motion? When reporting total sales and sales revenue, include average revenue per deal so managers see mix, not just revenue generated. When these numbers drift, they tell you exactly which lever to pull before the quarter is lost.
Tier 3: The 3 Strategic Metrics (monthly or quarterly health checks)
At the top of the pyramid are the strategic KPIs. These don’t change daily—and that’s the point. They’re the board-level guardrails that keep your sales engine sustainable.
10) Customer Acquisition Cost (CAC)
Formula: (Sales + Marketing costs) ÷ New customers
Benchmark: Treat <⅓ of ACV as a rough guardrail, then validate with CAC payback under 12 months.
👉 Why it matters: CAC is the profitability guardrail. Skewed attribution hides true cost. Always use fully loaded CAC—not just ad spend—if you want an honest picture.
11) CLV:CAC Ratio
Formula: Customer Lifetime Value ÷ CAC
Benchmarks:
- 3:1 minimum
- 4:1 optimal
👉 Why it matters: Below 3:1 = unsustainable. Above 4:1 = efficient growth. Pair this with Net Revenue Retention (NRR) for a true read on SaaS health.
💡Tips. CLV improves with retention, expansion, and a longer average customer lifespan. For SaaS, pair Revenue Intelligence with annual recurring revenue (ARR) and Net Revenue Retention for a truer growth picture.
12) Pipeline coverage
Formula: Total pipeline value ÷ Quota
Benchmark: 3× minimum (4–5× if win rate is low).
👉 Why it matters: Coverage is a confidence metric. Too little and you’ll miss. Too much and you’re padding the funnel with junk. What matters is whether coverage × win rate = quota. Everything else is noise.
💡Tips. Strategic metrics aren’t there to micromanage reps. They’re there to keep leadership honest. If activity and performance are the daily sprints, these are the altitude checks that tell you whether the company is climbing or stalling.
3 Sales Leaders on the KPIs They Actually Track (mini-panel)
It's not just theory. Some of the sharpest sales leaders I know run their teams on short KPI lists—deliberately simple, ruthlessly consistent. The pattern is clear: the fewer KPIs they track, the more impact they drive. Here’s how three of them keep score.

Armand Agha-Musset
Head of Sales, AssoConnect, 15+ sales reps
North Star: Signed revenue and new clients. Tracked daily — it’s literally his Chrome homepage.
Sales Metrics Framework
1. Inputs (what goes into the pipeline): Are reps “getting enough to eat?” Every week he checks:
- Opportunities created
- Meetings booked (inbound + outbound)
2. Activity snapshot (is the team actually working?): Weekly pulse on:
- Scored pipeline health
- Meetings held per rep
- Prospecting volume (calls + emails, balanced against deal follow-up)
3. Abnormal deals (lean methodology lens): Any opp with:
- No activity >7 days
- No next step in the next 14 days
- Lead time >3 months
These are flagged weekly to keep “pace and cadence” intact.
4. Outputs / performance analysis (is it working?): Monthly review of:
- Lost deals (count + reasons) — with a twist: if no deals are marked lost in a week, it’s a red flag the pipeline isn’t updated (Armand’s “green M&Ms” test)
- Conversion rates
- Lead times (min / max / avg)
- Main objections surfaced in calls (Tips: Claap helps capture and categorize these)
Coaching style: Weekly 1:1s and deal reviews, either with him or his sales leads, where they dig into each opportunity with pipeline data + call snippets.

Dmytro Chervonyi
CMO & Co-Founder, Forecastio
- North Star: Forecast accuracy within ±10% and 3–4× pipeline coverage by segment.
- Weekly checks: Win-rate trends by ICP, stage-level cycle length, deal-size mix, and stage-weighted coverage vs. quota.
- Golden rule: Coverage × win rate must = quota. If the math doesn’t work, fix the inputs (volume, ICP, messaging)—don’t “hopecast.”
- Coaching style: Loss post-mortems with call clips, objection/competitor tagging, and forecast reviews limited to deals with a dated next step.

Lee Correa
Sales Leader & Advisor
- North Star: Engagement quality over volume. Focus: meetings sourced from social + high-intent ICP interactions.
- Weekly checks: ICP connection acceptance, meaningful comments/DMs, warm-intro rate, social-touch → meeting conversion, and network growth in ICP titles.
- Golden rule: No vanity counts. If it doesn’t progress the deal (intro, meeting, or next step), it doesn’t hit the dashboard.
- Coaching style: Profile and content hygiene, comment-first outreach, gamified social actions, and clip reviews of social-sourced calls.
Different roles, different contexts—but the pattern is the same: they track fewer, more meaningful metrics. That’s the thread running through all high-performing teams. Which brings us to a bigger question: why does focusing on less actually work better?
Why should sales teams track fewer metrics?
The metric overload crisis
Most sales teams don’t fail from lack of data—they fail from drowning in it. The average team tracks 20+ metrics, yet leaders admit they only act on a handful. Sales forums call this “dashboard theater”: managers obsessing over charts while reps still miss quota.
It’s not just cosmetic, it’s costly. McKinsey research shows focused, data-driven teams can lift productivity by 5–10% when analytics improve frontline decisions.
The 80/20 rule for sales metrics
Not every metric deserves a widget. Roughly 20% of KPIs explain 80% of results. The pyramid framework forces focus:
- 5 daily activity levers
- 4 weekly performance checks
- 3 monthly strategic drivers
When I coach teams, I ask: “Which metrics actually drive your decisions?” The silence that follows says it all. If a metric doesn’t trigger a decision or coaching action, it doesn’t belong on your dashboard.
Leading vs. lagging: balance, not bias
The other trap is leaning too far in one direction.
- Leading indicators (calls, meetings, pipeline adds) show where you’re going.
- Lagging indicators (win rate, revenue, CAC) show where you’ve been.
High-performing teams keep a 60/40 balance: enough leading to act in real time, enough lagging to validate outcomes. Too much lagging, and you’re just staring in the rearview mirror.
From less to impact
Fewer metrics aren’t about minimalism—they’re about impact. The question isn’t “what can we track?” but “what should we act on?” Put those on one screen, review them on a cadence, and ignore the rest. That’s how dashboards become coaching tools instead of vanity walls.

How do you build a focused sales dashboard?
Dashboards fail when they try to do too much. The best ones follow three simple rules:
- One screen, no scroll — if it’s not visible at a glance, it won’t get used.
- One chart = one question — if a chart doesn’t drive a decision, it doesn’t belong.
- Right frequency, right refresh — daily for activity, weekly for performance, monthly for strategy.
Role-based views matter too. What an SDR needs to see (calls, meetings booked, response time) is very different from what a VP of Sales needs (win rate, pipeline coverage, CAC/CLV).
How does Claap make sales dashboards actionable?
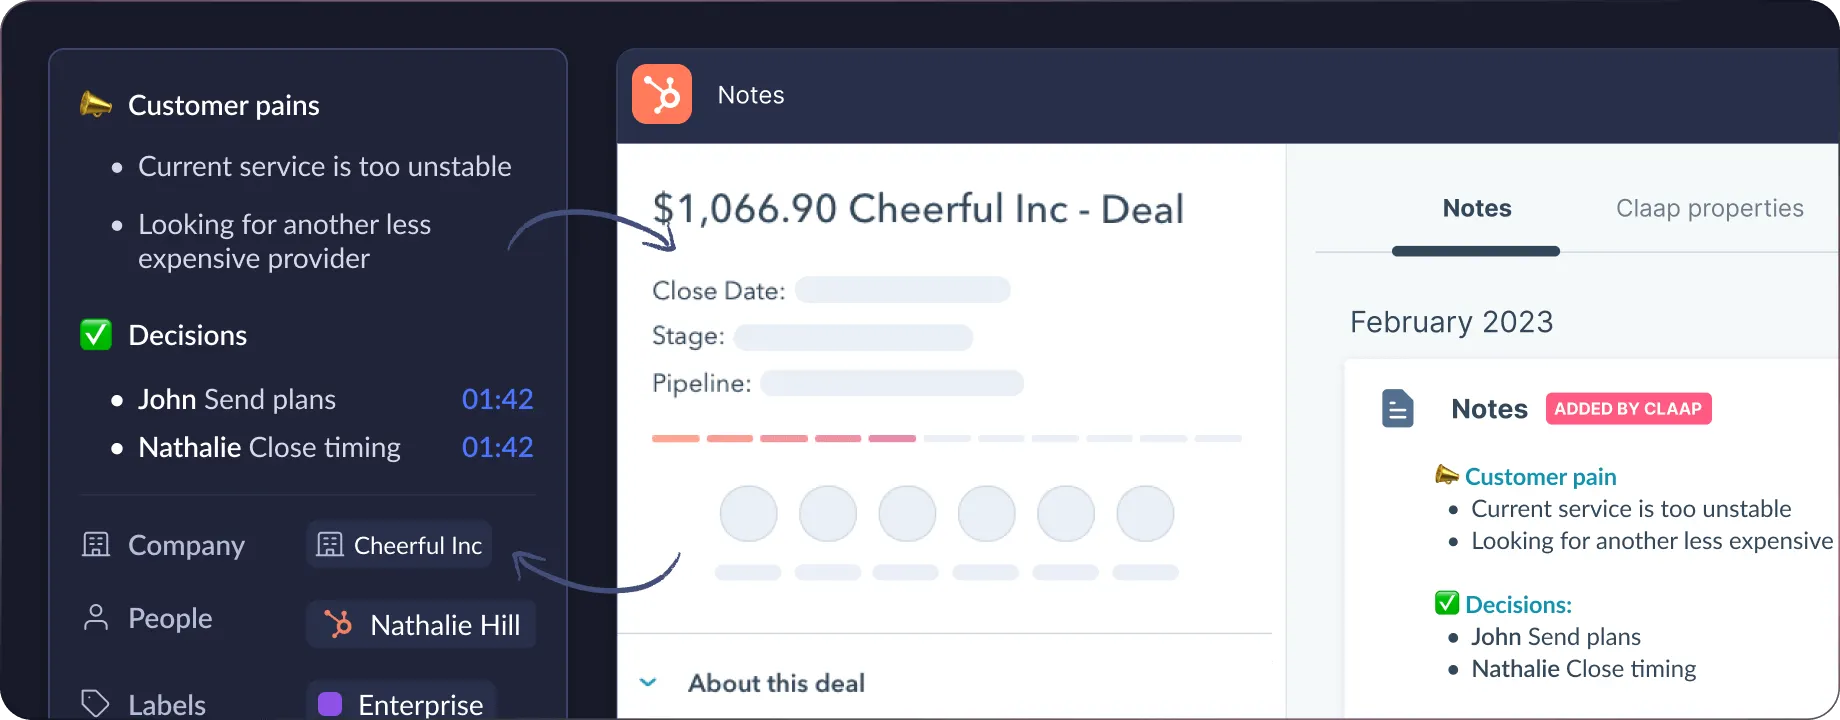
Traditional dashboards surface the what but rarely the why. Claap closes that gap by recording sales conversations, enriching CRM context, activating AI agents through MCP, and coaching teams from real call evidence:
- Conversation Intelligence — real-time call highlights feed into your activity metrics.
- Deal Pipeline Insights — flag stalled opportunities in your performance layer.
- Revenue Intelligence — roll up win rates, deal sizes, and objections into board-ready views.
- Sales Coaching — link coaching clips directly to metrics so reps see what to improve
Implementation roadmap: Rolling Out in 90 Days
Implementing a focused dashboard doesn’t have to be overwhelming. Here’s a simple playbook:
- Week 1: Baseline your current metrics and definitions.
- Weeks 2–3: Instrument the 12 KPIs; set alerts for exceptions.
- Week 4: Launch role-based dashboards and train managers.
- Month 2: Refine thresholds; automate recap notes with Call Highlights.
- Month 3: Drive full adoption by assigning KPI owners.
Review cadences that actually work
Design is only half the battle—cadence is what makes dashboards work. Here’s the rhythm I recommend:
- Daily (5 minutes): Activity metrics — SDR stand-up with yesterday’s call highlights and exceptions.
- Weekly (30 minutes): Performance metrics — pipeline inspection, win-rate review, deal coaching with clips.
- Monthly (60 minutes): Strategic metrics — CAC, CLV:CAC, pipeline coverage, NRR (for SaaS).
- Quarterly: Step back and ask if the 12 KPIs are still the right ones for your business.
With this rhythm, managers spend less time chasing spreadsheets and more time coaching. Reps see that data isn’t busywork—it actually helps them close deals.
Get Started Faster
Want a head start? Clone our 12-KPI dashboard blueprint and plug in your data definitions.
By now, you’ve got the structure: the pyramid, the metrics, the dashboards, the cadence. But leadership reviews always surface tough questions. Let’s wrap with the FAQs I hear most often.
FAQs on Sales Metrics
1. How many sales metrics should a team track?
We recommend 12–15 sales key performance indicators that reflect the company's sales reality, not theory.
High-performing teams focus on fewer KPIs that drive revenue. Research and Reddit ops forums show that tracking 20+ metrics dilutes coaching time and slows decision-making.
Our pyramid (5 daily activity, 4 weekly performance, 3 strategic) enforces discipline. Use other KPIs (talk ratio, forecast accuracy, no-show rate) as contextual add-ons, but avoid turning them into the main scoreboard.
2. What are the most important sales metrics in 2026?
Based on industry benchmarks, five metrics consistently predict growth. Sales Velocity is the master KPI, combining opportunity volume, deal size, win rate, and cycle length. Win Rate and Cycle Length are direct efficiency levers. CAC and Pipeline Coverage serve as board-level guardrails.
3. What’s the difference between sales metrics and KPIs?
Every KPI is a metric, but not every metric is a KPI. For example, “emails sent” is a metric, while “meeting-to-opportunity conversion rate” is a KPI if it ties directly to quota. The key is intentional selection: KPIs answer “Are we on track to hit targets?”; metrics simply describe activity or outcomes.
4. What’s the difference between leading and lagging indicators?
Leading indicators (conversations, response time, meeting conversion) show where performance is headed. Lagging indicators (revenue, win rate, CAC) validate what already happened. High-performing teams keep ~60% leading to allow for course-correction, 40% lagging to confirm outcomes. Winning by Design reframes this as Volume (inputs), Conversion (effectiveness), and Time (speed).
5. How often should I review sales metrics?
Review cadence should match how fast a metric can change:
- Daily: activity inputs (conversations, response time)
- Weekly: performance outcomes (win rate, cycle)
- Monthly/Quarterly: strategic guardrails (CAC, CLV:CAC, pipeline coverage)
6. What is sales velocity, and why is it important?
Sales Velocity is the compound KPI that brings together the four core levers: opportunity volume, average deal size, win rate, and sales cycle length. Small improvements in any lever compound overall velocity. Winning by Design’s Bowtie model maps the same logic to volume, conversion, and time. It’s also highly coachable: reduce cycle friction, sharpen discovery to lift win rate, or adjust ICP to increase deal size.
7. What’s a good win rate and sales cycle length?
Benchmarks vary by industry, ACV, and deal complexity. SaaS mid-market typically sits at 25–30% win rate with 60–90 day cycles. Enterprise deals with large buying committees can stretch 180+ days but should still be multi-threaded early.
8. Is speed-to-lead still critical in 2026?
Yes. Oldroyd’s lead response study found reps are 8–21× more likely to qualify a lead if they respond within 5 minutes. Lead-response research also shows that 35–50% of deals go to the first responder. With AI routing, there’s no excuse for lag: Slack alerts, CRM triggers, and call sequences can keep teams under 1 hour, ideally under 5 minutes.
9. What’s the role of NRR (Net Revenue Retention) in sales metrics?
While not part of every sales org’s pyramid, NRR is essential in SaaS. It measures how much recurring revenue you keep and expand. 2025 benchmarks put SMB around 97%, mid-market around 108%, and enterprise around 118%. Improving NRR compounds ARR growth and makes CAC payback faster. Leaders often swap pipeline coverage for NRR when retention is the bigger lever.
10. What metrics should I avoid tracking?
Vanity metrics look good on paper but don’t change behavior. Tracking “calls made” encourages volume over quality. Better: track qualified conversations or meeting-to-opportunity conversion. Same with “email open rate” or “demo scheduled” without downstream impact. A good litmus test: If you don’t coach or decide based on it, don’t track it.
11. How do I get reps to adopt metrics?
Adoption fails when KPIs feel imposed. Winning teams co-create dashboards with reps, limit KPIs to one screen, and coach from data they trust (e.g., Claap Call Highlights).
12. Why do most sales dashboards fail?
Dashboards often collapse under their own weight. Common issues: too many metrics (20+ tracked, few acted on), unclear definitions (“what counts as an opportunity?”), and static views that lack context for coaching. Fewer KPIs, agreed definitions, and tools that surface “the why” help managers coach more effectively.
Bonus KPIs (Appendix)
These aren’t core for every team but add value in specific contexts like coaching, forecasting, or inbound consistency.
| KPI | Formula / Definition | Benchmark | Why It Matters |
|---|---|---|---|
| Talk Ratio | % of time rep talks vs. prospect | 40–60% rep talk | Reveals discovery quality; strong calls skew toward the prospect talking more. |
| Forecast Accuracy | (Forecast ÷ Actual) × 100 | ±10% | Builds executive confidence; poor accuracy signals pipeline issues. |
| No-Show Rate | No-shows ÷ total meetings | <20% | Diagnoses lead quality & scheduling effectiveness. |
| Lead Treatment Adherence | % of inbound leads followed by process | 100% | Ensures consistency; missed steps waste marketing spend. |
| Churn Rate | Customers lost ÷ total customers | <5% annual (SaaS varies) | Links directly to NRR and CLV; critical for SaaS health. |
💡Tip: Use these only when they answer a real business question.
FAQ


![13 Key SaaS Sales Metrics with Examples [2026]](https://cdn.prod.website-files.com/6262a9705cabe0833039d5c8/69f2196ff5c3175e25c258d7_Visual%20(3).png)
.png)
.png)
