![Sales Performance Analysis: Metrics, Methods & Tools [2026]](https://cdn.prod.website-files.com/6262a9705cabe0833039d5c8/69f1eb71c133edd842c6afdf_Visual.png)
Sales performance analysis directly impacts revenue. Yet most sales organizations still analyze performance too late. Dashboards focus on revenue and quota after the quarter is over. By then, the deals are already decided.
Teams using revenue-specific AI are 65% more likely to increase win rates and generate 77% more revenue per rep than teams that don’t. These results are not driven by more activity, but by better insight.
I see the same pattern across B2B teams.
Plenty of data exists, but very little of it explains why deals move forward or stall. Many teams don’t analyze sales conversations, and as a result, behaviors remain invisible and coaching becomes reactive.
This guide explains how sales performance analysis is applied in high-performing B2B teams. It covers the core metrics and shows how to turn data into predictable revenue growth.
What Is Sales Performance Analysis? (And Why the Old Way Failed)
Sales performance analysis has fundamentally changed. I’ve watched this shift happen across B2B teams over the past few years. What was once a reporting exercise has become a decision-making discipline.
The old model focused on reviewing numbers after outcomes were already set. That approach helped explain results, but it rarely influenced them. Modern teams now rely on revenue intelligence, where performance analysis is anchored in real sales interactions.
Today, effective sales performance analysis focuses on what happens during conversations because that is where deals move forward or slow down. When I work with high-performing teams, they analyze conversations and interactions to understand:
- Where buyers show strong intent or hesitation
- How reps position value at key moments
- How objections surface and are handled
- How pricing discussions affect deal momentum
- How next steps are defined and owned
This shift aligns with how sales technology is evolving. As Ketan Karkhanis, EVP and GM of Sales Cloud at Salesforce, explains, the goal is to help sellers “spend less time logging data and more time engaging with customers.”
12 Essential Sales Metrics & KPIs to Track
When I review sales performance, I start by separating outcome metrics from action metrics. The first one explains what happened and the other tells you what to do next. I noticed that mixing both weakens the analysis.
Lagging indicators: measuring outcomes
These metrics confirm how your sales motion performed once the deals are closed. They matter for accountability and planning.
- Revenue growth: Shows overall trajectory and market traction.
- Win rate: Revenue intelligence adoption is associated with a 6% increase in win rates, because teams analyze what actually happens during deals.
- Average deal size: Helps you understand value capture and positioning quality.
- Customer acquisition cost (CAC): Links sales efficiency to financial sustainability.
- Customer lifetime value (CLV): Indicates long-term revenue quality, not short-term wins.
- Revenue per rep: Shows how effectively revenue is generated across the team.
Leading indicators: predicting performance
These metrics deserve priority because they influence outcomes while deals are active.
- Pipeline velocity. Formula: (Number of opportunities × Average deal size × Win rate) ÷ Sales cycle length
- Lead response time. Faster responses correlate with higher conversion rates.
- Conversion rates by stage: Reveal where momentum slows.
- Activity efficiency: Focuses on impact, not volume.
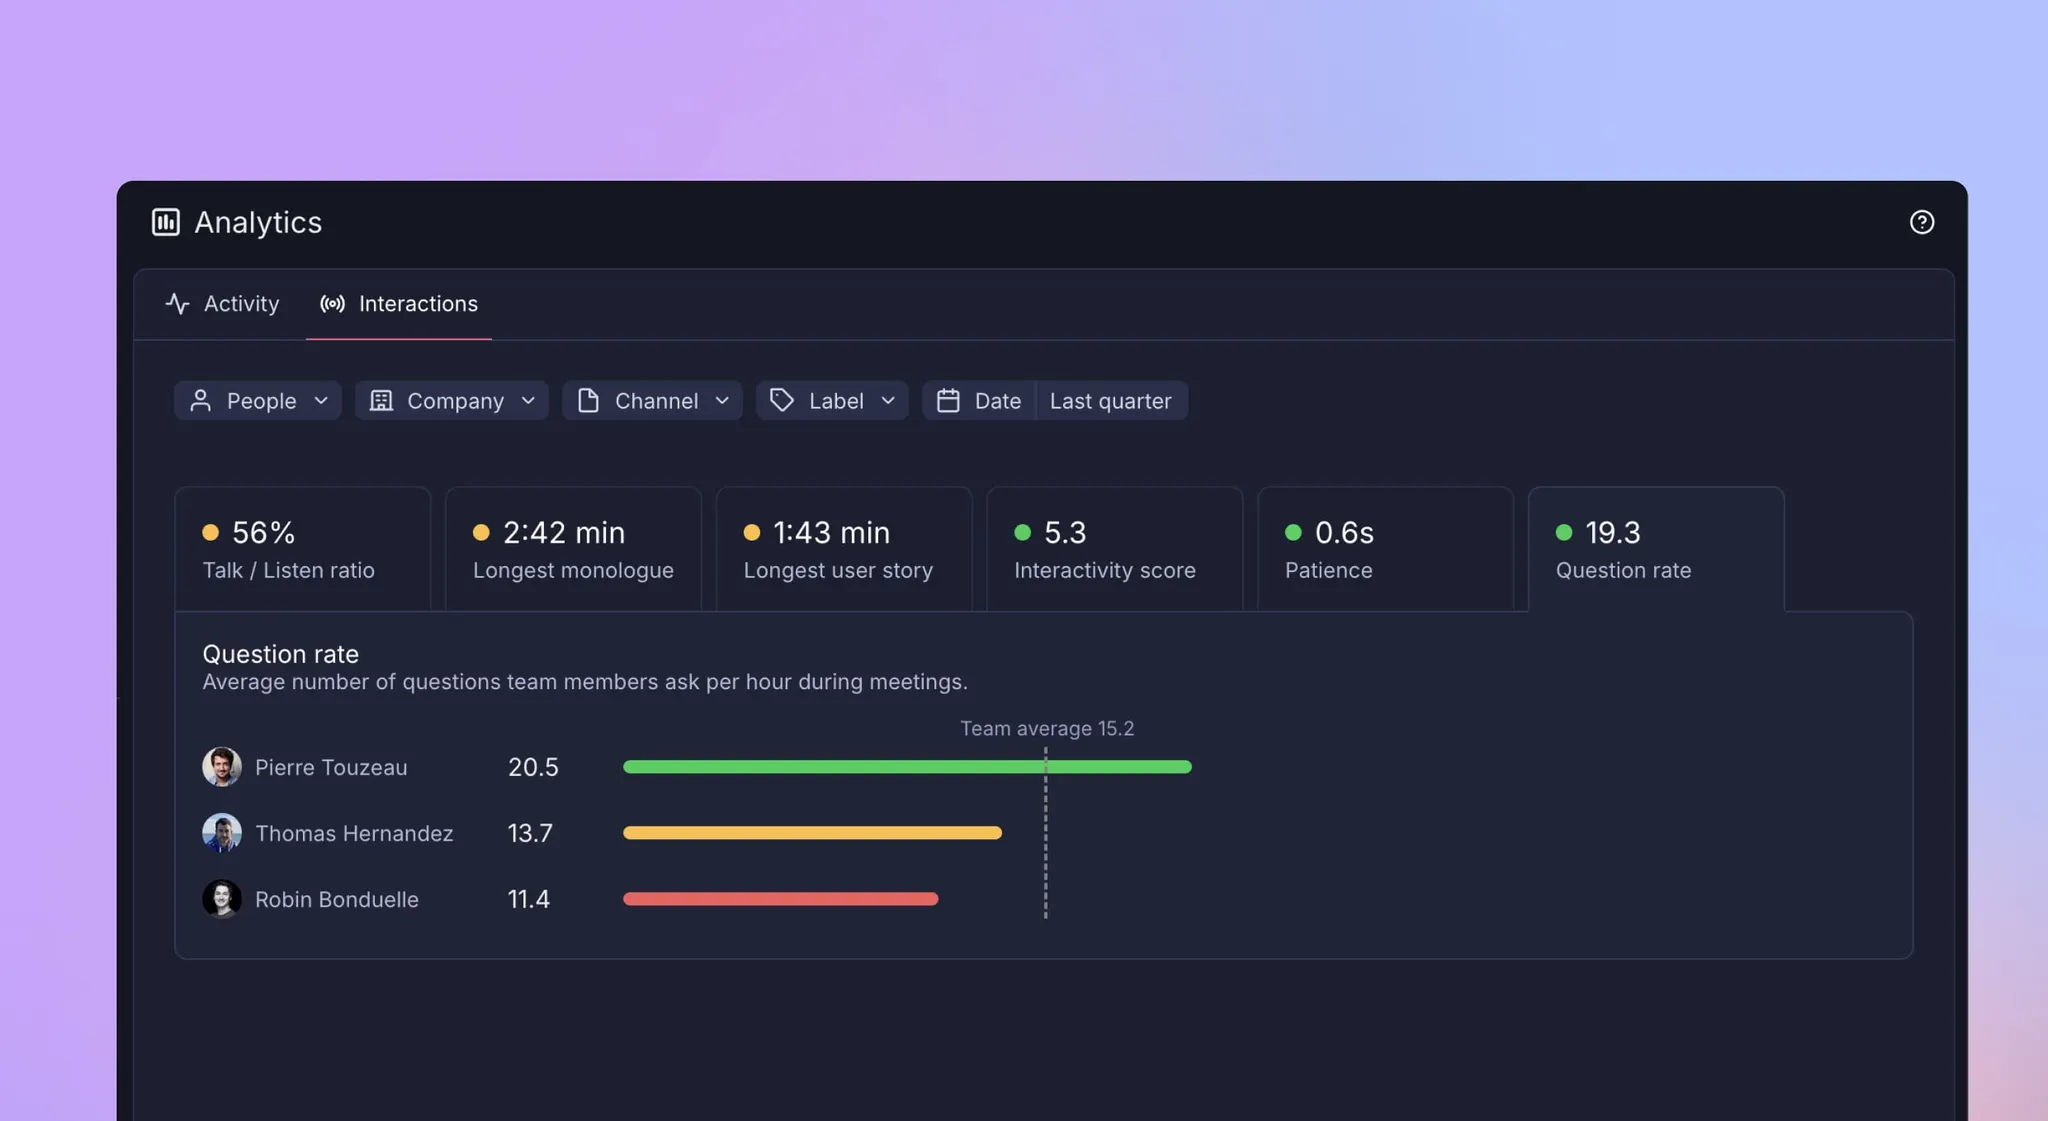
- Conversation quality: Measured through talk-to-listen ratios and question depth. Conversation intelligence allows you to coach specific skills instead of reviewing generic activity.
- Sales cycle length: Highlights how quickly deals move from first contact to close.
Context note
Pipeline velocity is a strong indicator in B2B sales, while transaction volume carries more weight in B2C models.
For a deeper breakdown of how these metrics connect, this guide on sales metrics is a helpful reference.
How to Perform a Sales Analysis in 5 Steps
When I run a sales analysis, I treat it as a decision-making exercise. The goal is not to describe performance, but to influence it while deals are still in motion. If analysis cannot guide action in the current cycle, it loses most of its value.
Step 1: Define the objective
A clear question is the starting point for any analysis. Without this focus, data collection lacks direction.For example, a simple question I used often: Why did revenue slow in Q3?
That question forces focus and helps you decide which metrics matter and which ones distract.
Step 2: Gather and clean the data
This step sets the ceiling for everything that follows. I never analyze before fixing data hygiene.
In practice, that means:
- Removing duplicate records
- Aligning fields across systems
- Capturing activity and conversation data consistently
Step 3: Choose the right analysis method
Different questions require different angles:
- Trend analysis helps you spot performance shifts over time
- Cohort analysis reveals gaps between groups, such as new hires and senior reps
- Pipeline analysis highlights where momentum slows
Each method narrows the problem and points toward a specific lever..
Step 4: Visualize and interpret
Moving from spreadsheets to clear visuals are essential at this stage, as they quickly reveal patterns.
This clarity helps to connect actions with results, allowing the discussion to focus on the elements that genuinely drive performance.
Step 5: Operationalize insights
Insights only matter when they help teams work better. Based on the findings, I develop coaching priorities or recommend adjustments to processes. As Forrester notes, modern dashboards should measure the impact of behavior change, not just activity volume.
For a deeper look at turning analysis into execution, this guide on improving sales performance is a useful reference.
The Sales Performance Report Template (What to Include)
When I share a sales performance report, I design it to accelerate decisions. Teams that leverage revenue-focused AI are more likely to improve win rates, largely because performance discussions move faster from diagnosis to execution
1. Executive summary
I always open with the bottom line up front (BLUF)—sometimes called TL;DR (“Too Long; Didn’t Read”). This section is designed to orient decision-makers immediately.
In a few lines, I summarize the primary performance issue and highlight the most important opportunity to address. A CEO should be able to understand the situation in under a minute, without scanning charts or appendices.
2. The “big number” scorecard
This section anchors the discussion on outcomes before diving into interpretation. The goal is to establish alignment from the outset.
The scorecard highlights:
- Revenue performance versus target, with clear direction
- Win rate versus plan, reflecting execution quality
- Pipeline generation compared to coverage requirements
- Trends versus the previous period, showing acceleration or slowdown
Visual indicators help gaps surface instantly and keep the conversation outcome-focused.
3. The context behind the numbers
Metrics always require framing. I provide concise context to explain what influenced performance during the period: shifts in demand, competitive moves, or internal changes such as pricing or positioning.
The goal is clarity, ensuring that interpretations are based on facts rather than assumptions.
4. Segment breakdown
This is where variance becomes visible. I break performance down by the dimension that best explains the gap: geography, product line, or rep experience, depending on the situation.
This perspective reveals execution patterns hidden by aggregated metrics, enabling leaders to pinpoint where intervention will be most effective.
5. Action plan
I always close the report with execution. Data creates value only when it changes behavior. Teams that automate data capture reduce administrative work by roughly 50%, freeing time for coaching and follow-up.
This section makes action explicit by defining:
- The specific behaviors or processes to adjust
- The teams or roles responsible for change
- The timeline for implementation
- The metrics used to track progress
- The checkpoint for reviewing impact
To keep reviews consistent, I recommend using a simple, downloadable report template.
Tools of the Trade: Excel vs. AI & Revenue Intelligence
When teams ask me which tools to use for sales performance analysis, I usually frame the answer in levels. Each level solves a problem but introduces new limits as scale and complexity increase.
Level 1: Spreadsheets (Excel, Google Sheets, …)
Early-stage teams often rely on spreadsheets for basic tracking because they are accessible and flexible. However, as activity grows, manual updates slow analysis, leading to outdated data and insights that only describe results already visible.
Level 2: CRM dashboards (Salesforce, HubSpot, Pipedrive, Attio, …)
CRM dashboards centralize data, track pipeline health, and monitor conversion rates, providing consistent reporting and visibility. However, their reliance on structured fields limits insight into the context of sales conversations..
Level 3: Revenue intelligence or Conversation intelligence tools (Claap, Gong, Modjo, Chorus…)

This is where sales performance analysis becomes truly operational. Revenue intelligence platforms go beyond raw numbers, analyzing sales conversations alongside performance data to uncover actionable insights. Conversation intelligence captures buyer reactions, rep behaviors, and key moments that directly influence deal outcomes - information that spreadsheets or CRM dashboards alone cannot provide.
With these tools, coaching shifts from activity review (“How many calls did you make?”) to skill-level execution (“How well did the rep handle objections? Did they uncover the decision criteria?”). Managers can identify patterns across calls, highlight strengths, and target improvement opportunities in real time.
For example:
- Detecting that reps consistently miss a qualification question early in discovery
- Spotting recurring objections and seeing how top performers handle them
- Measuring talk–listen ratios or the effectiveness of value articulation
Platforms like Claap turn these insights into structured coaching material, live playbooks, and training assets, ensuring the knowledge of top reps spreads across the team. This integration allows teams to close performance gaps faster, scale coaching efficiently, and directly tie conversation behavior to deal outcomes.
Win rates improve because insights are timely, contextual, and actionable, rather than delayed or anecdotal. Unlike spreadsheets and CRM dashboards, which often rely on incomplete, outdated, or inconsistent data, revenue intelligence tools make analysis continuous, operational, and tied directly to real conversations.
{{BANNER}}
All interactions are captured and stored, allowing for retroactive analysis across deals, reps, and periods. This means managers can track patterns over time, uncover hidden performance gaps, and make data-driven coaching decisions based on complete, accurate, and actionable insights - transforming raw conversation data into measurable sales impact.
3 Common Analysis Mistakes to Avoid
When I review how teams approach sales analysis, I see the same mistakes repeated. They rarely stem from lack of effort, they come from poor structure and unclear priorities.
- Fragmented stacks
Many teams rely on too many disconnected tools. Each tool captures a slice of data, but none provide a full picture.
The result is low adoption and inconsistent reporting. Integrated sales stacks show 58% higher tool adoption and stronger data utilization because insights live in one place.
When systems talk to each other, your analysis becomes faster and easier to act on. A clear overview of how tools should work together is covered in this sales analytics guide,
- Ignoring privacy requirements
Conversation analysis only works when it respects privacy rules. Recording meetings without clear consent creates legal risk and erodes trust.
Teams in regulated markets must adhere to GDPR, requiring transparency and purpose limitation. When recording is responsible and consent is embedded, the risk drops significantly at scale.
Tools like Claap’s meeting recorder support this approach by capturing conversations with built-in consent and clear control over recorded content.
- Analysis paralysis
Another common issue is tracking too many metrics. Raw activity numbers, like call volume, may feel reassuring, but they rarely explain performance.
High-performing teams prioritize outcome-driven metrics, such as meetings booked or deal progression. To keep analysis actionable, focus on meaningful indicators—tracking everything slows decisions instead of improving them.
From Sales Performance Analysis to Revenue Lift with Claap
I often see teams invest heavily in analysis but stop short of impact. Numbers show performance, but they rarely improve it on their own. Revenue grows when analysis directly informs coaching and execution, as these examples demonstrate.
Case study 1: Increasing deal value at RonSpot
The challenge
RonSpot aimed to move upmarket and close more enterprise deals. That shift required tighter scripts and stronger value communication across the team.
The analysis
Claire Heskin, Chief Growth Officer at RonSpot, used Claap to track how sales scripts were actually used in real conversations. The focus was on message consistency and how value was positioned during key moments.
The results
- +26% increase in average deal value
- +33% demo conversion rate, driven by alignment on the most effective sales stories
As Claire explains:
“We’ve increased the share of value captured from 26% to 35% of our target deals. That’s a big jump, and Claap gave us the visibility to know what was working.”
Read the full RonSpot story
Case study 2: Boosting win rates at TenderApp
The challenge
TenderApp rolled out the SPICED methodology and needed consistent adoption across the team.
The analysis
Sjors de Kleijn, Head of RevOps, used Claap to review qualification quality and identify coaching gaps at scale.
The results
- 66% uplift in win rates in one quarter
- SQL-to-win rate increased from 9% to 15%
Read the full TenderApp story
Key takeaway
These examples highlight a simple truth: analysis creates clarity, but results come from sharper coaching and consistent messaging. Claap bridges that gap by turning performance analysis into concrete behavioral change that shows up directly in revenue.
Sales performance analysis only creates value when it leads to better decisions and execution. Teams that treat analysis as reporting remain reactive, while those that connect it to real conversations gain leverage while deals are still in motion.
The shift is clear: modern sales performance analysis focuses on behaviors, not just outcomes. It examines what happens in conversations and how those moments influence deal momentum. Stronger execution then shows up as higher deal values and improved win rates. Claap sits at this intersection, turning sales conversations into usable insight and helping teams act on what actually drives revenue.
{{BANNER}}
FAQ
What is the difference between sales analysis and revenue intelligence?
Sales analysis reviews historical CRM data to explain past sales performance. Revenue intelligence uses AI to analyze live signals, including conversations, to identify risks and opportunities during active deals and support coaching and prioritization.
Does conversation intelligence actually increase sales?
Yes. Teams using conversation intelligence see around 30% higher conversion rates and up to 25% revenue growth, because buyer behavior and rep execution become visible and coachable at the skill level.
How do I calculate pipeline velocity?
Pipeline velocity measures how fast revenue moves through your pipeline.
Formula: (Sales Opportunities × Deal Value × Win Rate) ÷ Sales Cycle Length.
It helps identify whether growth comes from volume, quality, efficiency, or speed.
What are the top sales KPIs for 2025?
The focus shifts to efficiency. Key metrics and KPIs include revenue per rep, CAC payback, and net revenue retention (NRR). These metrics reflect execution quality, sustainable growth, and long-term value creation.
Is Excel enough for sales analysis?
Excel works for small teams with low volume. As teams scale, manual updates slow analysis. AI tools automate data capture, saving around 50% of admin time and allowing sales teams to focus on coaching and execution.
How do I analyze sales data in Excel?
Export CRM data, use pivot tables to group by rep or stage, and apply conditional formatting to spot trends. This supports retrospective analysis but requires regular manual updates and strong data hygiene.
What is the difference between sales reporting and sales analysis?
Sales reporting summarizes outcomes like revenue or win rates. Sales analysis explains why those results occurred and what actions to take next. Reporting shows results while analysis guides improvement.
How often should I run a sales performance analysis?
Review sales pipeline weekly to manage risk. Analyze market trends monthly to spot execution gaps. Revisit sales strategy quarterly to adjust positioning, pricing, and go-to-market focus. This cadence keeps sales teams proactive.


![13 Key SaaS Sales Metrics with Examples [2026]](https://cdn.prod.website-files.com/6262a9705cabe0833039d5c8/69f2196ff5c3175e25c258d7_Visual%20(3).png)
.png)
.png)
